Africa Regional Data Cube Webinar - November 30, 2018
A webinar hosted by the Africa Open Data Network (AODN)

Sign-up for the Open Data Cube mailing list!
Land Change
Contributed by CEOS SEO/AMA
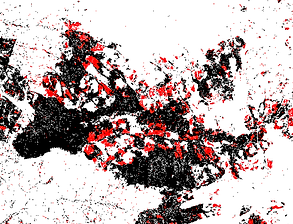
The Notebook linked below uses changes in NDVI, EVI, or Fractional Cover to identify land changes. The algorithm identifies a "baseline" and "analysis" time period and then compares the spectral parameters in each. Significant reductions in vegetation are coincident with land change. In some cases these changes could be deforestation.
Users of this algorithm should not accept the accuracy of the results without conducting ground validation testing. In most cases, these algorithms can be used to identify clusters of pixels that have experienced change and allow targeted investigation of those areas by local or regional governments.
Explore the Application
View the Notebook and sample outputs here.
Want to use the example Notebook on your own Data Cube and data?
Download the Notebook from GitHub here and run it on your own Cube in a Box installation.
Tutorial
-
All DCAL notebooks begin by specifying a location, time window, and product of interest.
-
The extents and products are examined and selected in the first 6 cells of the notebook, with user options available in 2nd and 4th cells, marked by "# CHANGE HERE >>>>>>>>>>>>>>>>>>".
-
Any values within the bounds detailed in the 4th cell will work, and it is suggested to keep the region and time period small. The resulting area is shown in red in cell 6.
-
You can click on the map to query the coordinates under the cursor.
-
In cells 7 and 8, you select the two time periods to compare, and the algorithm used to generate cloud free mosaics from those times.
-
In cells 10 and 11, you load two Data Cubes, one for the baseline and one for the comparison analysis.
-
Cells 12-23 clean and create mosaics of the time periods. The cloud free mosaics are shown in cells 24 and 25.